24 Hr Emergency Response
800-377-3648

10,000 Environmental Remediations Since 1975
Remtech © 2024
| CAREERS |
| Contact Us
Abstract
Remtech conducted pilot treatability tests on 440,000 gallons of fire runoff water contained in twenty-two (22) frac tanks from a chemical plant fire that was extinguished with AFFF foam. Samples were collected and independant treatment efficacy laboratory analysis reported by Keith Cole, Ramboll Group.1, 2 Pilot tests and design specifications were prepared by Mark Ryckman, Remtech Engineers.3 PFAS concentrations ranged from 253,649 ppt to 13,185,500 ppt in 6 of the 22 frac tanks. Waste from all 22 tanks were equalized and treated through a pilot treatment train consisting of screening, equalization,
sedimentation, non-harvesting aeration/foam fractionation, sand filtration, and three-stage Granular Activated Carbon Filtration (GAC). 27.97% of PFAS was removed by aeration, and 99.993% were removed by all unit operations. This treatment method demonstrated that both long and short chain PFAS analytes were effectively removed. Powdered Activated Carbon (PAC) dosed at a self-flocculating 1,000 mg/l concentration removed 34.5% of PFAS following 48 hours of clarification. Correlation curves with a field COD meter were developed with laboratory data to predict PFAS concentrations approaching EPA target
PFAS treatment values to reduce the laboratory testing frequencies and costs.
Background
Remtech developed a mobile treatment design to treat runoff water from a chemical plant fire that had total PFAS concentrations ranging from 253,649 ppt to 13,185,500 ppt in 6 of 22 frac tanks. Household products, fragrances, sports drinks, tapes, and road-paving materials were manufactured from processed pine tree stumps into resins, rosins, waxes, and gums. Pilot/bench-scale tests are required to properly design a fullscale wastewater treatment system.4
Waste Characterization & Preparation
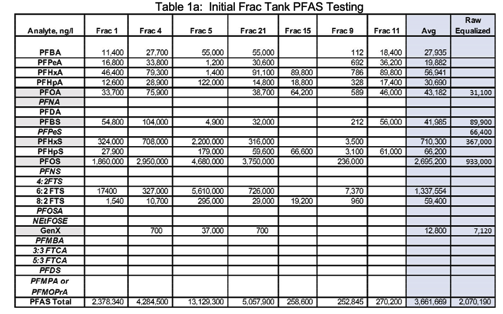
Initial samples were collected from six (6) of the 22 frac tanks and tested for PFAS (using EPA Method 533) and general chemistry analytes. The results are presented in Tables 1a and 1b. Herbicides, heavy metals, mercury, and organochlorine pesticides were also tested on the initial 6 frac tank samples. These analytes were below pretreatment requirements of the POTW and were not run on Pilot Runs 1 and 2.
EPA analytical methods employed for PFAS and General Chemistry analyses are summarized below:
✦ pH - Method: (SM-4500-+)
✦ VOCs - Method: 8260D GC/MS
✦ Organochlorine Pesticides - Method: SW846 8081B (GC)
✦ Herbicides - Method: SW846 8151A (GC)
✦ Metals (ICP) - Total Recoverable - Method: EPA 200.7 Rev 4.4
✦ Total Hardness (as CaCO3) by calculation - Method: SM 2340B-2011
✦ Mercury (CVAA) - Method: EPA 245.1-1994 R3.0
✦ Oil & Grease - HEM (1664A)
✦ Total Suspended Solids - (SM 2540D-2015)
✦ Chemical Oxygen Demand (SM 5220D-2011)
✦ Total Organic Carbon TOC (SM 5310 B-2011)
✦ PFAS - EPA Method 533 was used for testing PFAS in the first 6 frac tanks
✦ PFAS - EPA Method 1633 was used for pilot testing 5
The frac tanks contained a floating layer of resins/oils, a suspension of suspended solids, and settled solids. Samples from frac tanks had highly variable pHs (ranging from 4.25 to 11.96), general chemistry analytes and PFAS concentrations suggesting that equalization was required. Results of initial testing are presented in Tables 1a & 1b.
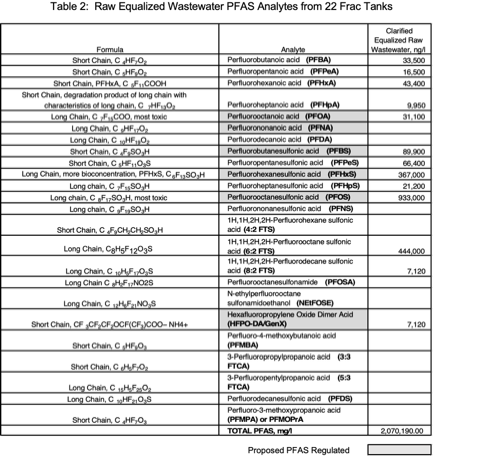
Due to the wide variation of analyte concentrations, one-gallon samples from all 22 frac tanks were collected and a 22-gallon equalized composite sample was prepared for pilot testing. This resulted in significantly lower analyte concentrations. The “Raw Equalized” sample is depicted in the “blue highlighted” portions of Tables 1a & 1b and Table 2. The equalized raw wastewater had a pH of 10.1212
Treatment Method & Goals
Environmental releases from chemical fires are known to produce toxic vapor clouds, contaminated runoff from firefighting operations, partially burnt chemicals and residues, heavy resins, and fire extinguishing agents. Past treatment unit operations used by Remtech on contaminated chemical plant fire runoff water included flow/concentration equalization, aeration, sedimentation, GAC filtration, and PAC addition at selfflocculating dosages of 1,000 mg/l combined with bentonite.6
Remtech’s treatment train design was based on the following documented PFAS treatability information:
Two of the preferred PFAS coal based GACs are CALGON’S F400M and General Carbon’s 12 X 40PF. General Carbon’s GAC was selected since this vendor claimed that their product outperformed CALGON’S carbon for PFAS removal.
Remtech’s mobile pretreatment plant was designed to reduce total PFAS concentrations to less than 200 ppt with a pH of 10.12 so a local POTW could accept the wastewater for further treatment.
Six (6) EPA proposed PFAS analytes to be regulated are PFOA, PFOS, PFNA, PFHxS, PFBS, HFPODA/GenX. Two of the most toxic long chains analytes are PFOS and PFOA. Activated carbon filtration has been reported to be more effective in removing long chain rather than short chain PFAS analytes.4 Of the six proposed regulated compounds, GenX and PFBS were the only short chain compounds reported in initial testing.
Treatment Goals
✦ Reduce PFAS concentrations down to a POTW pretreatment goal of less than 200 ppt
✦ Determine if 12 x 40PF carbon is effective in removing very high concentrations of long and short chain PFAS analytes
✦ Determine treatment efficiency of sedimentation, aeration, GAC, and PAC
✦ Determine if a field COD test kit could predict final PFAS concentrations to reduce the frequency of expensive lab costs
Pilot Plant Setup
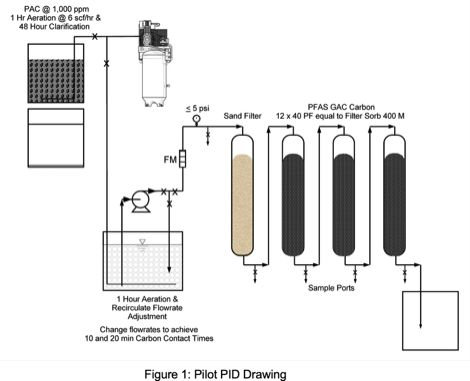
Wastewater was first passed through a 35 mesh (50 micron) screen to remove floating and suspended scum. Selected unit operations were screening, sedimentation, non-harvesting aeration/foam fractionation, sand filtration, and three GAC columns in series.
Sand media selected was Filtersil which is a high-purity monocrystalline industrial quartz sand for mixed media and pressure filters for potable, process, and wastewater filtration. Filtersil specifications are: Grade 0.85, Effective Size (mm) 0.78, Uniformity Coefficient 1.47, Prior Grade designation WG#1, Approximate Screen Slot Size (inches) 0.030), bulk density 79-80 lb/cf loose, 83-85 lb/cf compacted.
Reactors, pumps, valves, fittings, and tubing selected were PFAS free. Following screening, wastewater
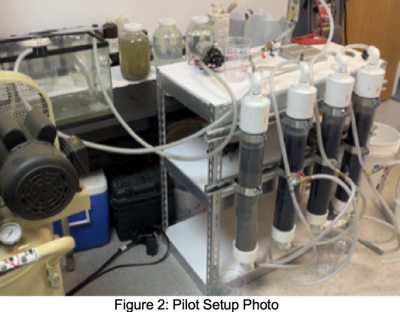
was allowed to settle in a 30-gallon poly overpack for 24 hours for Run 1. Water was pumped with an agricultural diaphragm pump (Pentair Shurflo,12-volt,1.8 gpm) into a 10-gallon covered glass reactor (12" L x 6" W x 8" H) that was aerated for 1 hour at 6 scfh with 40 micron diffusers prior to running through four identical PVC columns (3" D x 26" H). Flowrates were measured with a King Liquid Flow meter (1 to 12 gph). Flowrates were controlled with a recirculation valve. Filter volumes and media charge rates are
listed in Table 3.
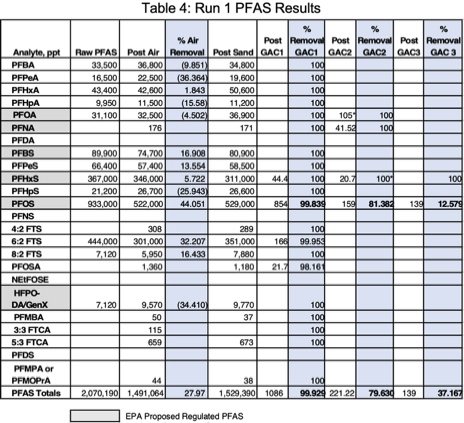
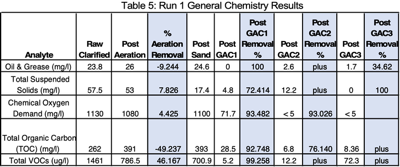
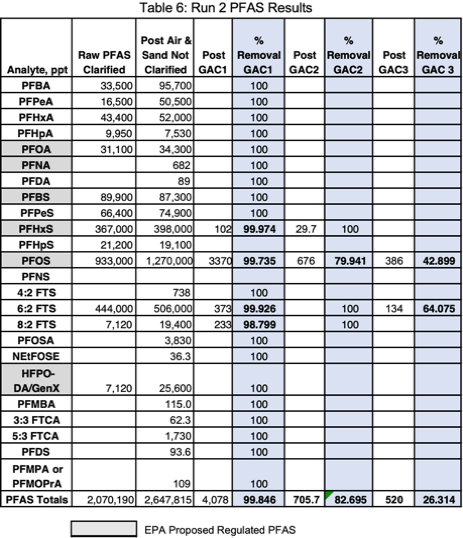
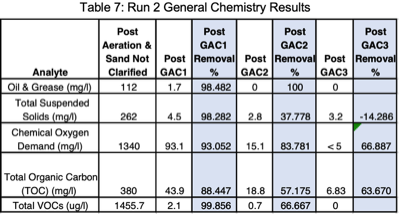
Two GAC runs (Runs 1 & 2) were conducted at two flowrates for carbon contact times of 10 and 20 minutes. Sample were collected from the raw wastewater, post aeration, and after each filter and were analyzed to determine removal efficiencies. The pilot test setup is depicted in Figures 1 and 2. Analytical results for Run 1 and Run 2 are presented in Tables 4, 5, 6 & 7.
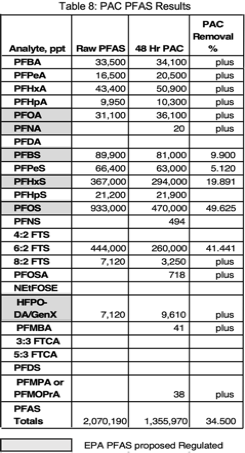
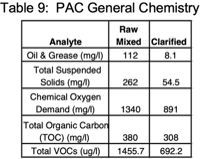
Raw wastewater was also treated with 1,000 ppm of PAC. PAC was mixed with air at 6 scfh for 1 hour then allowed to settle for 48 hours then tested for PFAS. Results are depicted in Tables 8 & 9. PAC was most effective in removing PFBS, PFPeS, PFHxS, PFOS, and 6:2 FTS.
Discussion & Results
GAC Run 1
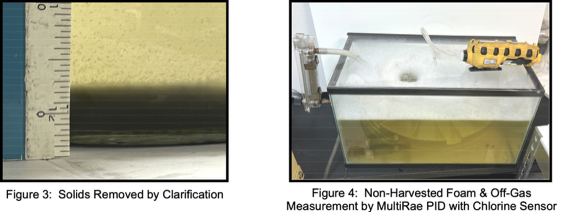
Run 1 was conducted at a flowrate of 0.0277 gpm and carbon contact time of 20 minutes. Clarified wastewater was introduced into the aeration chamber (Figure 3). A significant finding was that 27.97% of PFAS was removed by aeration. Lab VOC analytes removed by aeration were 46.17%. Off-gas VOC emissions during aeration were measured with a MultiRae PID (10.6 e.v. lamp) with a chlorine sensor - 3.5 ppm PID and 1 ppm chlorine. The average correction factor for VOC analytes (reported by method SW846 8260D GC/MS) with this meter is 0.56 or approximately 1.2 ppm. The total lab reported VOC was 1.46 mg/l (Table 9). Considerable foam was generated during aeration (Figure 4). To prevent the need for foam harvesting, the aeration rate was controlled at 6 scfh.
The first GAC column removed all of the following short chain PFAS analytes below laboratory detection limits; PFBA, PFPeA, PFHxA, PFHpA, PFBS, PFPeS, 4:2 FTS, GenX, PFMBA, 3:3 FTCA, and PFMPA. The long-chain PFAS analytes (PFHpS, 8:2 FTS, and 5:3 FTCA) were also removed by the first GAC column. Only PFOS remained after the 3rd GAC column. Each GAC column removed a reduced amount of PFOS; first column - 99.84%, second column - 81.38%, and 12.58% by the 3rd column. A final concentration of 139 ppt remained for an overall PFAS removal efficiency of 99.993% through the complete treatment train
(Table 4).
Total removal efficiencies for VOCs were 95.05%, COD 99.56%, TOC 96.44%, Oil & Grease 92.86%, and TSS 100% (Table 5). When either lab COD or TOC concentrations are less than 10 mg/l, PFAS concentration approach EPA’s proposed treatment goals.
GAC Run 2
Run 2 was at twice the flowrate (0.0555 gpm) and a carbon contact time of 10 minutes. Foam was removed by the first GAC column (Figure 5). This test was initiated with mixed wastewater from the 30-gallon overpack that introduced suspended solids into the aeration chamber and increased loadings on the sand filter (Figure 6). This produced a higher raw wastewater concentration of PFAS due to desorption of soluble PFAS from suspended solids - 2,647,815 ppt. An estimated 577,625 ppt PFAS were likely desorbed from
the increased suspended solids loading.
Two analytes remained after the 3rd GAC column, PFOS at 386 ppt, and 6:2 FTS at 134 ppt. Short chain PFAS analytes removed below detection limits by the first GAC column were PFBA, PFPeA, PFHxA, PFHpA, PFBS, PFPeS, 4:2 FTS, GenX, PFMBA, 3:3 FTCA, and PFMPA. Long chain analytes removed by the first column were PFOA, PFNA, PFDA, PFHpS, PFOSA, NEtFOSE, 5:3 FTCA, and PFDS. A final concentration of 520 ppt or 386 ppt PFOS (of the proposed regulated PFAS analytes) remained for an
overall PFAS removal efficiency of 99.985% (Table 7). A higher filter backpressure of 5 psi was observed due to the additional TSS loadings on the sand and GAC filters.
Run 2 had higher General Chemistry values across the board except for Total VOCs which were about the same as Run 1; +78.93% Oil & Grease, +78.005% TSS, +15.67% COD, and +31.05% TOC, that resulted in slightly lower treatment efficiencies (Tables 7 & 9). If clarified raw wastewater had been used in Run 2, the total raw PFAS concentration would have been 21.82% less and it is likely that similar overall treatment efficiencies to Run 1 would have been achieved at twice the flowrate and half the carbon contact time
(10 min).
PAC Test
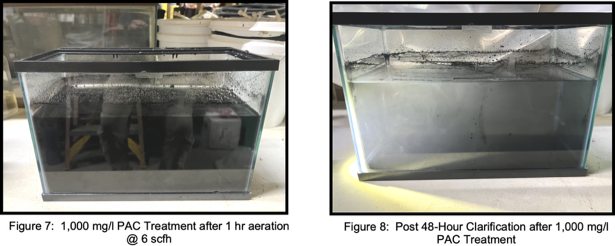
Mixed raw waste with suspended solids (Figure 7) was dosed with 1,000 mg/l PAC, aerated for 1 hour at 6 scfh, and allowed to settle for 48 hours (Figure 8) to see if a synergistic removal of particulate and solution phase PFAS removal could be achieved. The overall PFAS removal was 34.5% (Table 8) with an estimated 28% removed by aeration. Note that TOC and COD final clarified concentrations were approximately 30 to 90 times higher respectively than 3rd GAC column effluent concentrations for the same analytes. Consequently an elevated concentration of PFAS remained in the clarified effluent. Coagulation with alum or other polymers should be investigated to determine if PAC treatment would perform better at a reduced pH.12
Field COD Meter PFAS Correlations
PFAS concentrations in landfill leachates have significant correlations with TOC, alkalinity, ammonia, and COD.13 Remtech set out to determine if similar PFAS laboratory and field meter COD correlations could be established for this wastewater matrix.
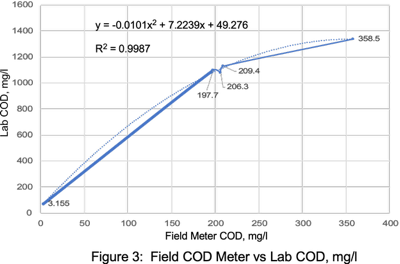
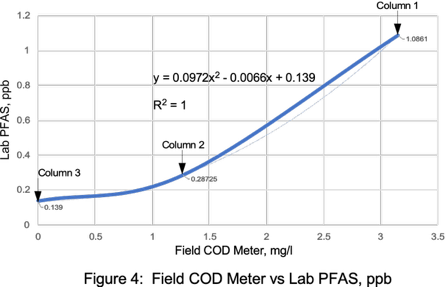
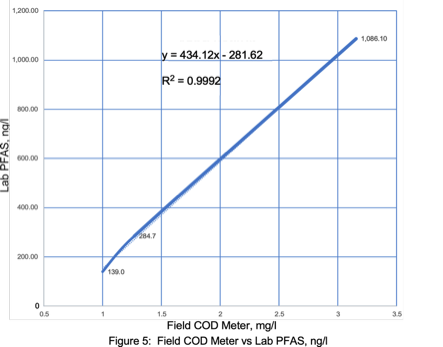
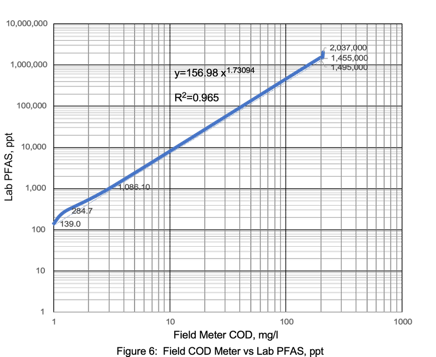
Laboratory COD correlation curves with a field COD meter resulted in a R2 value of 0.9987 (Figure 9). PFAS versus field COD meter correlations resulted in a R2 values ranging from 0.9992 to 1.0 (Figures 10 & 11). Correlations with higher COD values resulted in a slightly lower R2 value of 0.965 (Figure 12). Field COD meters have the potential to reduce PFAS lab costs by identifying trends that suggest required lab PFAS treatment efficiencies have been reached when field meter COD values approach 0.0 mg/l.
Typical turnaround times for PFAS lab analysis may be 15 days for some labs. Shorter turnarounds can increase unit charges by 1.5 to 2 times. For a 5-day rush turnarounds, estimated lab costs (prices may vary significantly between labs) are presented below:
• EPA PFAS Method 533 - $600/sample
• EPA PFAS Method 1633 - $700/sample
• For VOC, Oil and Grease, TSS, COD, and TOC - $217.80/sample (for all 5 parameters)
Additional parameters that may need to be run for certain matrices include; alkalinity, heavy metals, pesticides, herbicides, and organochlorines.
When either lab COD or TOC values are less than 10 mg/l after GAC filtration, PFAS concentrations are typically in the range of 4 to 100 ppt. Correlation curves need to be prepared for each waste stream with appropriate variations in concentrations.
Treatment System Design
Carbon Column Design Criteria
Table 3 displays the mass loading, reactor volumes, and flowrates for pilot Runs 1 & 2. Scaling up to a flowrate of 35 gallons for Run 1, an estimated 2,448.10 lbs of GAC are required for each full-scale carbon filter or a total of 7,344.03 pounds for all three GAC filters. When the flowrate is doubled in Run 2, an estimated 1,745.43 lbs of GAC is required for each full-scale filter or a total of 5,236.28 lbs for all three GAC filters at a flowrate of 50 gpm.
Surface loading rates for the two runs are summarized below:
• Pilot carbon column area = ((3.14 x 9)/4)/144 in2 = 0.049 sf
• Run 1; Surface Loading Rate = 0.0277/0.049 = 0.565 gpm/sf @ 20 min contact time
• Run 2; Surface Loading Rate = 0.0555/0.049 = 1.133 gpm/sf @ 10 min contact time
GAC pressurized filter design criteria for much lower PFAS feed concentrations suggest surface loading rates ranging from 2 to 10 gpm/sf for treatment plant flowrates ranging from 1 - 12 MGD and empty bed contact time ranging from 10 to 20 minutes.7,14 GAC surface loading rates for the treatment of PFAS contaminated fire runoff water for this matrix appears to be in the range of 0.56 to 1.13 gpm/sf with an untreated PFAS concentration ranging from 2 to 2.6 mg/l providing clarification, aeration, and sand filtration
is provided upstream.
Suitable activated carbons show incipient breakthrough for PFOS at 30,000 to 40,000 Bed Volumes (BV) and for PFOA at 20,000 to 30,000 BV. GAC absorbers are considered to be effective and feasible taking into account operational and economic factors so long as a specific throughput of at least 15,000 BV can be achieved.15,16 Actual BVs prior to media changeout for this highly contaminated PFAS matrix is unknown.
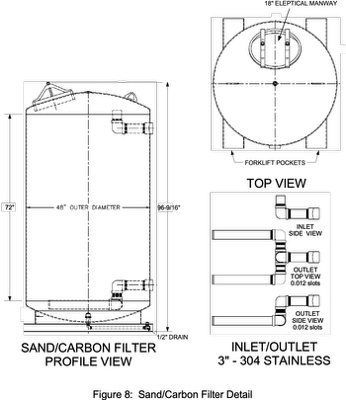
Using 3 carbon columns that contain 2,000 lbs of carbon with dimensions of 4 ft diameter and 6 ft tall, the BV would be 7,328 gallons for each filter (Figure 14). Assuming that 15,000 to 40,000 BV would result in PFAS breakthrough, then the volume of water treated prior to media changeout could be between 109,920 to 293,120 gallons. With 440,000 gallons to be treated one to two media changeouts may be required. Actual BVs needs to be field verified to determine actual media changeouts.
Sand Filter Design
For Runs 1 & 2; 7,266.2 lbs and 5,179.8 pounds of sand are required respectively. An average of 6,203 lbs of sand was selected to be placed in one of the 2,000 lb carbon reactors. Back pressures near 10 psi may require filter back-washing.
Aeration Chamber Design
Using a 21,000 gallon frac tank for batch aeration for 1 hour operating at 18,000 gallons with Remtech’s Magnetic Aeration System - installed through a 20" manhole17, the the non-harvesting foam aeration rate is calculated below:
• 6 scfh/60 - 0.1 cfm, 40 micron diffusers, volume of wastewater treated = 5 gallons (reactor volumes including sample volumes removed for lab testing)
• 0.1/5 = X/18,000 = 360 cfm. Aeration/mixing requirements demonstrated by Remtech on previous projects - 60 to 120 cfm for each frac tank. 120 cfm was selected
Actual aeration rates to produce non-harvesting foam generation rates needs to be field verified.
Vapor Off Gas Treatment Design (optional, not currently regulated)
• 579,126 ng/l (579.13 ug/l) of PFAS removed in Run1, 1,456 ug/l VOCs removed in Run2
• Total of 2,035 ug/l of volatiles removed from 5 gallons of wastewater
• 394.5 lbs of volatiles need to be removed from 440,000 gallons of wastewater
• Assume that 1 pound carbon removes 0.4 lbs of VOCs or 986.2 pounds of carbon required
• Selected three (3) 300 lb carbon vapor absorbers operating at 150 cfm
Full-Scale MobileTreatment Train
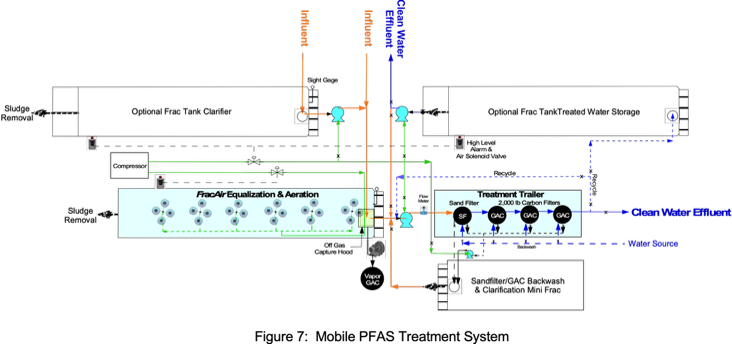
Diaphragm pumps with 25 ft suction lifts were selected to remove wastewater from 22 frac tanks from the top manholes with adjustable depth suction hoses with inlet screens. Withdrawing wastewater from mid- depths will leave floating and settled solids in each tank. Wastewater is then pumped to a 21,000 frac tank for settling, then pumped to another frac tank with Remtech’s Magnetic Aeration System for pulsed aeration for 1 hour at 120 scfm (Figure 13).
After settling and aeration, wastewater is pumped through the mobile treatment trailer with sand and tri-GAC filters. Initial flowrates to be increased from approximately 5 gpm with PFAS removal efficiencies demonstrated as flowrates are increased.
Field COD vs Lab correlation curves can be used as predictive final lab PFAS concentrations to minimize lab analytical costs. Additional Frac holding tanks may be used to hold treated water until discharge limits are verified by lab analysis. Backwash media filter water is pumped to a 9,000 gallon mini-frac settling tank with clarified water directed back to the initial 21,000 gallon settling frac tank.
Spent GAC media is removed and sent for regeneration and reuse. Spent sand filter and solids from the 22 fracs will be removed by vacuum truck, dewatered, tested and disposed of at an approved disposal facility.
A schematic of the full-scale system is presented in Figures 13 & 14. The estimated cost of this system for one month of operation is $450,000 plus disposal of remaining solids in frac tanks. Note that 50% of estimated costs are associated with labor intensive efforts to operate multiple pumps and manifolds required to remove wastewater from 22 frac tanks that is transferred to the initial clarification frac tank.
Summary
Remtech has demonstrated that this type of mobile treatment system is effective in removing very high concentrations of short and long chain PFAS analytes using a combination treatment train consisting of screening, sedimentation, non-harvesting foam aeration, sand filtration, and tri GAC filtration using General Carbon’s 12 x 40PF PFAS carbon.
PFAS expensive laboratory costs can be reduced by using Remtech’s proprietary field COD test meter by developing correlation curves between laboratory COD and PFAS data for each specific waste stream.
This same mobile treatment process can be used for landfill leachates, wastewater, drinking water, and other more dilute PFAS waste streams. Pilot/bench scale tests are required to determine appropriate carbon mass, flowrate loadings, carbon contact times, aeration times, and sandfilter loading rates for each waste stream to meet discharge limits.
Funding
This project was funded in part by a confidential client with funding for the majority of pilot testing and design, manuscript preparation, and editing provided by Mark Ryckman, Remtech Engineers and Keith Cole, Ramboll Group.
References
1. Cole, Keith, Senior Managing Consultant, Ramboll Group, Sample Collection and Laboratory Analysis Reporting, 2023.
2. Eurofins Environmental Testing, Savannah, GA, 2023.
3. Ryckman, Mark, Principal Engineer, Remtech Engineers, Pilot Plant Design, Testing, and Full-Scale Design, 2023.
4. AWWA, Drinking Water Treatment for PFAS Selection Guide - Technical Support on Per- and polyfluoroalkyl Substances Policy, 2020
5. USEPA, Office of Water (4303T), Office of Science and Technology Engineering and Analysis Division, Washington, DC, EPA 821-D-23-001, 4th Draft Method 1633* Analysis of Per- and Polyfluoroalkyl Substances (PFAS) in Aqueous, Solid, Biosolids, and Tissue Samples by LC-MS/MS, July, 2023.
6. Ryckman, M.D., Emergency Response to a Major Agricultural Chemical Warehouse Fire, Proceedings of the 36th, Industrial Waste
Conference, Purdue University, May 12, 13, 14, 1981. https://www.remtech-eng.com/downloads/remtech-environmentalpublications.
7. Black and Veatch Project No. 409850, WITAF 56 Technical Memorandum PFAS National Cost Model Report, prepared for the
American Water Works Association, March 7, 2023.
8. Smith, Sanne J., et. al, Pilot-Scale Continuous Foam Fractionation for the Removal of Per and Polyfluoroalkyl Substances (PFAS) from Landfill Leachate, Environmental Science and Technology, 2022, 2, 841-851.
9. Yuan, Shideng, et.al., Contribution of Air-Water Interface in Removing PFAS from Drinking Water: Adsorption, Stability, Interaction and Machine Learning Studies, Water Research, Volume 236, June 1, 2023, 119947.
10. Smith, Sanne J., et.al., Foam Fractionation for Removal of Per- and Polyfluoroalkyl Substances: Towards Closing the Mass Balance, Science of the Total Environment, 871 (2023) 162050.
11. Grimison, Charles, et., al, The Efficacy of Soil Washing for the Remediation of Per and Poly-fluoroalkyl Substances (PFASs) in the
Field, Journal of Hazardous Materials, Volume 445, March 5, 2023, 130441.
12. Zhang, Zhiming, et. al. Adsorption of Perfluorooctanoic Acid (PFOA) and Perfluorooctanesulfonic Acid (PFOS) by Aluminum-based
Drinking Water Treatment Residuals, Journal of Hazardous Materials Letters, 2021 100034.
13. Zang, Hekai, et., al., Relationships Between Per- and Polyfluoroalkyl Substances (PFAS) and Physical-Chemical Parameters in
Aqueous Landfill Samples, Chemosphere, Volume 329, July 2023, 138541.
14. Newton, Jim, Introduction to PFAS D175/D175, PDHonline.com, PE Continuing Education Course, 2023.
15. McMnamara, James D, et., al., Comparison of Activated Carbons for Removal of Perfluorinated Compounds From Drinking Water,
https://doi.org/10.5942/jawwa.2018.110.0003.
16. Riegel, Marcel, et., al., Sorptive Removal of Short‑chain Perfluoroalkyl Substances (PFAS) during Drinking Water Treatment using
Activated Carbon and Anion Exchanger, Environmental Sciences Europe (2023) 35:12, https://doi.org/10.1186/s12302-023-00716-5.
17. Remtech’s FracTank Mobile Magnetic Aeration System, www.remtech-eng.com/store-/frac-tank-magnetic-aeration-system.
18. Morrison, Anthony L., Impact of Salinity and Temperature on Removal of PFAS Species from Water by Aeration in the Absence of
Additional Surfactants: A Novel Application of Green Chemistry Using Adsorptive Bubble Fractionation, Industrial & Engineering
Chemistry Research, 2023, 62, 5635−5645.
19. Nguyen, Thi Minh Hong, et. al., Influences of Chemical Properties, Soil Properties, and Solution pH on Soil−Water Partitioning
Coefficients of Per- and Polyfluoroalkyl Substances (PFASs), Environmental Science & Technology, 2020, 54, 15883-15892.
20. Krogerstrom, Axel, Removal of per- and Polyfluoroalkyl Substances (PFAS) from Contaminated Leachate using Aeration Foam
Fractionation, Department of Aquatic Sciences and Assessments, Swedish University of Agricultural Sciences (SLU) UPTEC 21020.
ISSN 1401-5765. Digitally published in DIVA, 2021 at the Department of Earth Sciences, Geotryckeriet, Uppsala University, Uppsala.
21. USEPA, Proposed PFAS National Primary Drinking Water Regulation, March 29, 2023.
22. AECOM, Evaluation of PFAS in Influent, Effluent, and Residuals of Wastewater Treatment Plants (WWTPS) in Michigan, Proj. No.
60588767, Prepared in association with Michigan Department of Environment, Great Lakes, and Energy, April 2021.
PFAS Mobile Treatment and PFAS Rapid Field Measurement of Fire Runoff Water from Chemical Plant Fire



Mark Ryckman, Remtech Engineers, January 30, 2024

- Complex organics, dissolved organic carbon (DOC), surfactants, suspended solids, TOC, and COD compete and interfere with for GAC and PAC absorption sites for PFAS removal and needs to be removed first
- Aeration/foam fractionation is an effective pretreatment to remove some PFAS analytes and to enhance post treatment with carbon or ion exchange filtration
- Foam fractionation produces extremely high concentrations of toxic vapors that requires off gas treatment
- Soluble PFAS analytes on particulates can be desorbed and transferred to the aqueous phase by mixing for treatment
- Particulate matter needs to be removed prior to filtration to reduce carbon column backwashing that decreases PFAS removal efficiencies by channeling of bed media
- PFAS removal efficiencies may increase with decreasing pH’s in the 3 to 7 range
- Aqueous and vapor phase coal based GAC effectively removes PFAS and can be regenerated for reuse
7
8,9
10
11
7
12